
COURSE 3 · READING CHARTS
Technical Analysis for Forex Beginners: What Charts Can and Can't Do
Four short lessons on reading a forex chart — each with an illustrated example and an honest section on what the tool cannot tell you. It comes after risk management on purpose.
By FirstPip editorial team · Updated 2026-10-13 · Educational content · No broker owns this site
Quick answer. Technical analysis studies past price on charts — candlesticks, support and resistance, trend lines, moving averages — to describe what the market has been doing and frame scenarios. It gives likelihoods, not certainties, and it cannot tell you the next price. Learn it after risk management, not instead of it.
What is technical analysis?
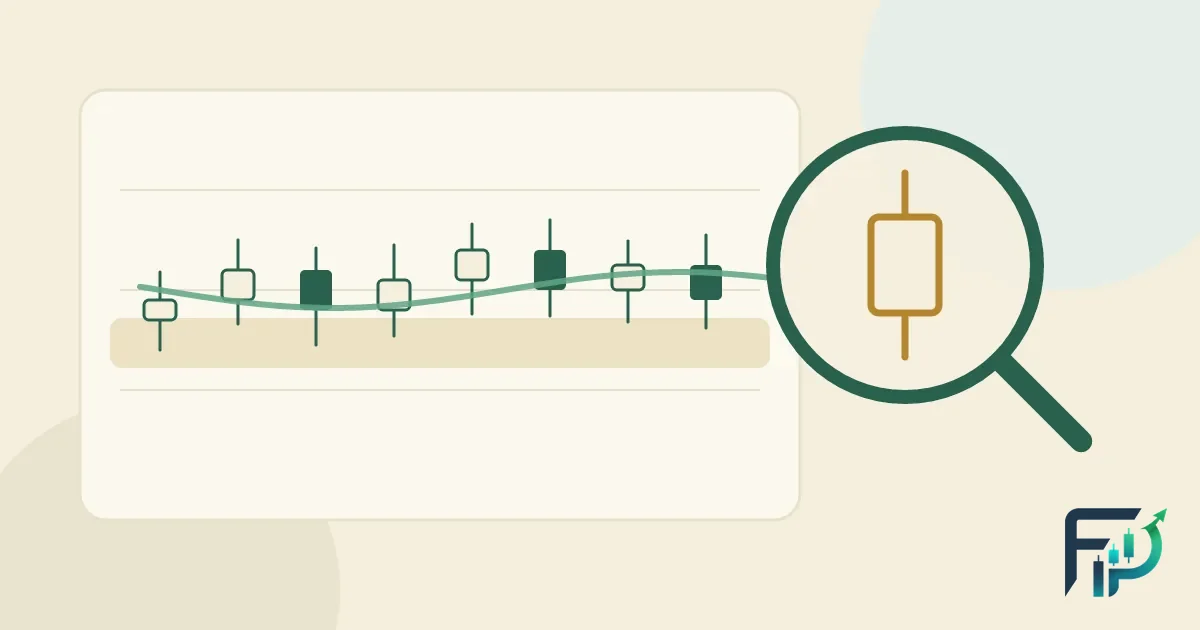
Technical analysis is the study of past price movements on a chart to describe what a market has been doing and to frame what might happen next. A technical analyst looks at the price itself — how it has moved, where it has stalled, how fast it has travelled — rather than at the economic reasons behind the move. In forex that means a chart of a currency pair such as EUR/USD — for example drawn as candlesticks — with a few lines and averages laid on top.
The honest one-line definition comes from StockCharts’ free ChartSchool reference: technical analysis deals in likelihoods, not certainties, much like a weather forecast (StockCharts ChartSchool). Keep that sentence in mind through every lesson in this course. A chart can tell you where price has been and how other traders have behaved around certain levels. It cannot tell you where price will be tomorrow.
What does technical analysis assume?
Technical analysis rests on a few ideas inherited from Dow Theory, which ChartSchool credits with laying the foundations of modern technical analysis. ChartSchool summarises them as: price reflects the information available to the market; price movements are not entirely random; and what price is doing matters more for the analyst than why it is doing it (StockCharts).
The same source adds practical conditions that make chart reading more meaningful: the market should be liquid, prices should not be distorted by artificial changes, and there should be no extreme news shock in progress. In forex the third condition cannot be taken for granted: central-bank decisions and economic releases can move a pair sharply, and ChartSchool is explicit that technical analysis cannot predict extreme events.
How is technical analysis different from fundamental analysis?
Fundamental analysis looks at the forces behind supply and demand; technical analysis looks at the price those forces produce. CME Group’s education course describes fundamental analysis as studying the factors that drive supply and demand, and technical analysis as studying price movement on charts — patterns, indicators and levels such as moving averages and previous highs and lows — and notes that many traders combine the two (CME Group).
| Question | Fundamental analysis | Technical analysis |
|---|---|---|
| What does it study? | Interest rates, inflation, growth, central-bank policy | The price chart itself: highs, lows, trends, averages |
| Typical question | “Why might this currency strengthen?” | “Where has price reacted before, and what is the trend?” |
| Main weakness | Complex, slow-moving, and shocks are hard to model | Subjective, late, and blind to news it cannot see |
| What it cannot do | Time the market precisely | Predict the next price |
For a beginner the choice is not either-or. What matters more than either method is that every trade idea — however it was found — is sized so that being wrong is survivable. That is why this site teaches why most traders lose and position sizing before any chart reading.
Does technical analysis work in forex?
The most careful answer is: sometimes, for some rules, for a while — and the published evidence suggests such edges fade over time. A Federal Reserve Bank of St. Louis working paper by Christopher Neely and Paul Weller reviewed the research on technical analysis in currency markets. It reports that simple technical trading rules on dollar exchange rates earned positive risk-adjusted returns for about 15 years in the 1970s and 1980s before those returns were extinguished, and that more complex, less-studied rules have since produced more modest returns (Neely & Weller, 2011). The authors read this as consistent with an “adaptive markets” view of the world — the hypothesis, as they summarise it, that financial markets gradually arbitrage away patterns as they become known.
Two practical lessons follow. First, a rule that “worked” on a chart you found online may simply describe a period that has passed. Second, the signals in this course are standard textbook material, freely taught — a good reason to be sceptical that they still carry an edge on their own.
Regulators’ own data shows what happens to most retail traders regardless of method. The US Commodity Futures Trading Commission reports that about two in three customers at registered forex dealers lost money over the year from Q2 2021 to Q1 2022 (CFTC). ESMA, the EU securities regulator, reported in March 2018 that national regulators’ analyses showed 74–89% of retail CFD accounts typically lose money (ESMA, 27 March 2018). The UK FCA describes CFDs as complex, high-risk products (FCA, October 2025). None of those figures says chart reading caused the losses — but none suggests that learning chart patterns protects you from them.
What are the weaknesses every beginner should know?
Every tool in this course shares the same limits. ChartSchool lists them plainly (StockCharts), and they are worth reading before you draw your first line:
- Analyst bias. If you already want to buy, you will find the chart that agrees with you.
- Subjectivity. Two people can read the same chart differently — where a level sits, whether a line is valid, which average to use.
- Lateness. Once a trend is clear enough to identify, a large part of the move is already over.
- Unreliable signals. Some signals and patterns simply fail.
- Blind to news. A chart cannot anticipate an extreme news event.
A useful habit: whenever a chart looks “obvious”, write down what would prove your reading wrong. If you cannot name it, you are not analysing — you are hoping.
What will you learn in this course?
Course 3 — Reading Charts — has four lessons, each built the same way: what the tool shows, how to draw or calculate it step by step with an illustrated example, and a section on what it cannot tell you.
- How to read candlestick charts — open, high, low and close in one shape; why a candle hides the order in which the high and low happened.
- Support and resistance — zones where price has reacted before, why they are zones rather than lines, and what a false break looks like.
- Trends and trend lines — higher highs and higher lows, how to draw a line that is not forced, and why a break is a warning rather than a signal.
- Moving averages — how a simple and an exponential average are calculated, with a worked numeric example, and why their lag can never be removed.
Why does this course come after risk management?
Because a wrong chart reading on a small position costs little, while a position too big for the account can do serious damage even when the reading was reasonable. This site deliberately puts risk per trade and stop-loss placement first.
Chart reading plugs into risk management at exactly one point: it helps you decide where an idea is proven wrong. That distance, in pips, then sets the position size. With a $5,000 account and a 1% risk limit you can lose $50 on the trade; if the chart says your idea is wrong 25 pips away and a standard lot of EUR/USD moves $10 per pip, the size is $50 ÷ (25 × $10) = 0.20 lot. The chart chose the distance; the arithmetic chose the size. You can run the same sum in the position size calculator. This is a worked example of the arithmetic, not a suggestion to trade.
How should a beginner practise technical analysis?
Practise without money at risk first, and keep score honestly. A sensible sequence:
- Read each lesson, then open any free chart of EUR/USD and find the thing it describes — a doji, a zone, a trend line, a moving average.
- Write down what you expect and what would prove you wrong, before looking at what happened next. A trading journal keeps you honest about hindsight.
- Use a demo account for any practice orders, and run every practice trade through the pre-trade checklist.
- Be wary of anyone selling “signals” or a chart strategy with guaranteed results; the scam red-flag card lists the warning signs regulators publish.
If you landed here first and want the bigger picture of what the site covers, the FirstPip homepage lays out the courses, glossary and calculators in one place.
Frequently asked questions
Is technical analysis worth learning for forex beginners?
It is worth learning to read a chart, because every trading platform shows one and you need to understand what you are looking at. It is not worth treating as a way to predict prices. Research on currency markets found simple chart rules stopped earning excess returns after the 1980s, and regulators report most retail accounts lose money. Learn it after risk management, as a way to describe the market and decide where an idea is wrong.
Can technical analysis predict forex prices?
No. Technical analysis describes what price has done and frames possible scenarios; at best it deals in likelihoods, not certainties. A chart cannot anticipate news such as a central-bank decision, and the same chart can be read differently by two people. Treat every reading as a scenario with a clear point at which it is wrong.
What should I learn first in technical analysis?
Start with candlestick charts, because every other tool is drawn on top of them. Then learn support and resistance, then trends and trend lines, then moving averages. Before any of these, learn risk per trade and position sizing, because they decide how much a wrong chart reading costs you.
Is technical analysis better than fundamental analysis?
Neither is better in general. Fundamental analysis studies the forces behind supply and demand, such as interest rates and inflation; technical analysis studies the price chart those forces produce. Many traders combine them. For a beginner, neither matters as much as sizing each trade so a loss is small.
Do I need paid indicators or software for technical analysis?
No. Candlesticks, support and resistance, trend lines and moving averages are available on free charting platforms. Paid indicators and signal services do not remove the basic limits of chart reading, and some are sold with exaggerated claims — be cautious with anyone promising consistent profits.
Keep going
Sources
- StockCharts ChartSchool — Technical Analysis (overview: likelihoods not certainties; weaknesses incl. analyst bias, subjectivity, lateness, unreliable signals)
- CME Group Education — Fundamental Analysis vs Technical Analysis
- Neely, C. J. & Weller, P. A. — Technical Analysis in the Foreign Exchange Market, Federal Reserve Bank of St. Louis Working Paper 2011-001 (revised July 2011)
- CFTC — Customer Advisory: Eight Things You Should Know Before Trading Forex (about two in three customers lost money, Q2 2021–Q1 2022)
- ESMA — “ESMA agrees to prohibit binary options and restrict CFDs to protect retail investors”, 27 March 2018 (national regulators’ analyses: 74–89% of retail CFD accounts typically lose money)
- FCA — “FCA warns investors in CFDs risk losing out on protections”, 30 October 2025 (CFDs are complex, high-risk products)
- StockCharts ChartSchool — Introduction to Candlesticks (body and shadows, doji, need for confirmation, candles do not show the order of high and low)
- StockCharts ChartSchool — Support & Resistance (zones vs exact levels, role reversal, false breakouts)
- StockCharts ChartSchool — Trend Lines (two points draw a line, a third confirms; steep lines less reliable; a break is a warning, not a confirmation)
- StockCharts ChartSchool — Moving Averages: Simple and Exponential (SMA/EMA formulas, multiplier 2 ÷ (periods + 1), lag, whipsaws)
- John J. Murphy — Technical Analysis of the Financial Markets (Prentice Hall Press, 1999) — publisher page
- Steve Nison — Japanese Candlestick Charting Techniques, 2nd edition (Prentice Hall Press, 2001) — publisher page