
COURSE 3 · READING CHARTS · LESSON 3
Trends and Trend Lines: How to Describe Direction Without Predicting It
A trend line is the simplest drawing on a chart and the easiest to fool yourself with. Learn the rules for drawing one honestly, and what a break does — and does not — mean.
By FirstPip editorial team · Updated 2026-10-13 · Educational content · No broker owns this site
Quick answer. A trend is the direction price has been moving: an uptrend makes higher highs and higher lows, a downtrend lower highs and lower lows. A trend line joins two swing lows (uptrend) or highs (downtrend); a third touch adds confidence. Trends end without warning, so lines describe, never promise.
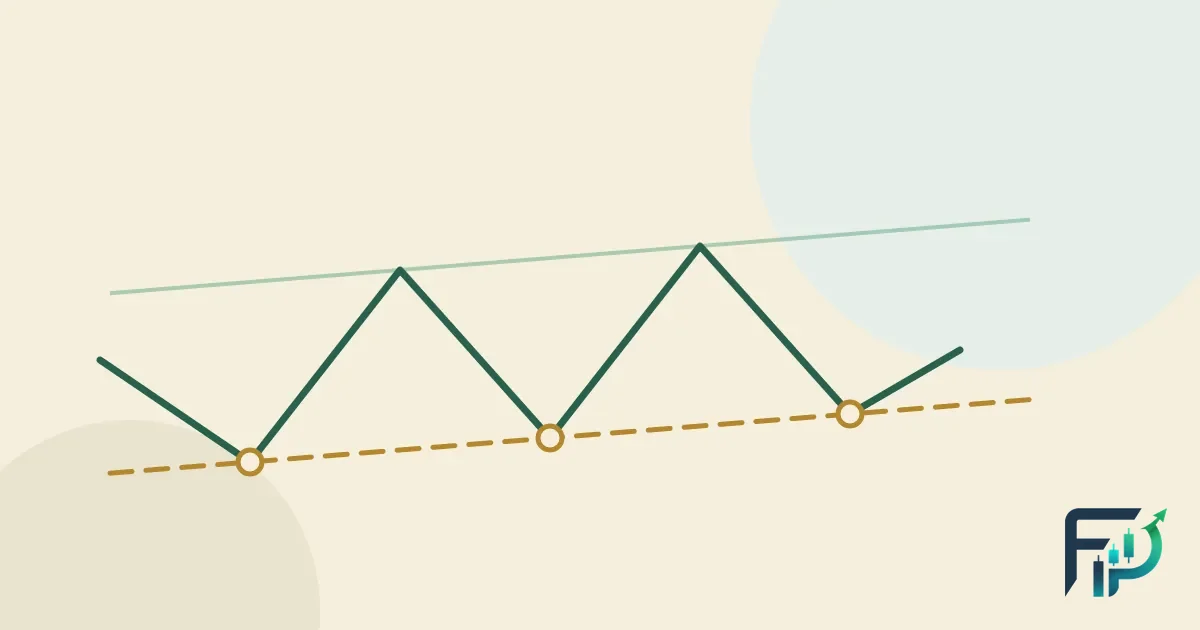
What is a trend in forex?
A trend is the general direction price has been moving over a chosen period. In an uptrend, each rally reaches a higher high and each pullback stops at a higher low. In a downtrend, the highs and lows both step lower. When neither pattern holds and price swings between roughly the same high and low, the market is in a range, also called a sideways market.
Notice that this definition is backward-looking. A trend is something price has been doing. CME Group’s course puts the key point simply: markets do not move in one direction indefinitely, and analysts look for signs of whether a trend is continuing or reversing (CME Group). Identifying a trend describes the present state of the chart; it does not tell you how long that state will last.
How do you identify higher highs and higher lows?
Mark the swing points — the peaks and troughs where price changed direction — and compare each one with the one before. The illustrative path in Figure 1 makes lows at 1.0800, 1.0830 and 1.0860, each 30 pips above the last, and highs at 1.0850, 1.0885 and 1.0915. Both series rise, so on this chart the trend is up.
| Swing point | Price (illustrative) | Compared with the previous one |
|---|---|---|
| Low 1 | 1.0800 | — |
| High 1 | 1.0850 | — |
| Low 2 | 1.0830 | 30 pips higher than low 1 |
| High 2 | 1.0885 | 35 pips higher than high 1 |
| Low 3 | 1.0860 | 30 pips higher than low 2 |
| High 3 | 1.0915 | 30 pips higher than high 2 |
If you are new to counting the distance between two prices, the lesson what is a pip shows how; every figure in the table is simply the price difference divided by 0.0001.
How do you draw a trend line?
A trend line is a straight line that joins swing points to make the trend visible. ChartSchool’s rules are the standard ones (StockCharts ChartSchool):
- Uptrend line: connect two or more swing lows, where the second low is higher than the first. The line slopes up and sits under price.
- Downtrend line: connect two or more swing highs, where the second high is lower than the first. The line slopes down and sits above price.
- Two points draw it, a third confirms it. Any two points make a line; it is the third touch that suggests other traders are respecting it.
- Do not force it. ChartSchool notes that drawing a trend line is not always possible — when the lows or highs don’t line up, it is best not to force one.
In Figure 1 the line runs through 1.0800 and 1.0830; because the third low at 1.0860 sits exactly on it, the line counts as “confirmed” by the usual rule. That word means only that the line fits three points so far. It says nothing about the fourth.
What makes a trend line more or less reliable?
ChartSchool lists the factors that separate a meaningful line from a decorative one (StockCharts):
- Number of touches. More touches add validity; two is the minimum to draw, three to call it confirmed.
- Spacing. Touches that are too close together or too far apart weaken the line; evenly spaced points are better.
- Steepness. Very steep lines, which come from a sharp move over a brief period, are less reliable — and the apparent angle changes with chart size and how much data is on screen.
- Scale. On long-term charts a logarithmic (percentage) scale can fit lines better than an arithmetic one, which can produce false breaks during big moves.
Every one of those factors involves judgement. Which lows count as swing points? Do you draw through the wicks or the bodies? How steep is “too steep”? Two careful people can draw two different lines on the same chart, and each line will produce different “breaks”.
Why does the timeframe change the trend?
Because trend is relative to the window you look through. EUR/USD can be in a downtrend on a weekly chart, a range on a daily chart and an uptrend on an hourly chart, all at once. None of these is the “real” trend; each describes a different slice of time.
It is tempting to pick the timeframe that agrees with the trade you already want. A more honest approach is to decide your timeframe first, describe the trend on it, and note what the next-larger timeframe shows as context.
What does a broken trend line mean?
A break is a warning, not a confirmation. ChartSchool is explicit: when price breaks a trend line, check other evidence — horizontal support and resistance or the pattern of peaks and troughs — and remember that false breaks happen (StockCharts). CME similarly cautions that patterns will not always signal continuation, and suggests using them with other evidence (CME Group).
In Figure 1, price closes at 1.0858 and then 1.0845, both below the line. The close at 1.0845 is also below the last swing low at 1.0860, so the higher-low sequence is in question too. Has the uptrend ended? Not necessarily: the next candles could just as easily climb back above both. That ambiguity is normal, and it is why the response to a break should be “reassess and check risk” rather than “act”.
What is a trend channel?
A channel adds a second line, parallel to the trend line, along the opposite swing points — through the highs in an uptrend or the lows in a downtrend. CME mentions drawing a line through the highs alongside the lows to form a channel (CME Group). A channel gives a visual range for the trend, but it carries all the limits of the trend line it is built from, doubled: two subjective lines instead of one.
What can trends and trend lines not tell you?
- When the trend ends. Every trend ends; the line does not say when. ChartSchool notes that once a trend is clear enough to identify, a large part of the move is already over (StockCharts).
- How far the next move goes. A higher low says nothing about the size of the next high.
- Whether a break is real. False breaks and fresh lines drawn after the fact make old charts look tidier than live ones.
- Whether following trends pays. Research on currency markets found that simple technical trading rules on dollar exchange rates earned excess returns in the 1970s and 1980s, but that those returns were later extinguished (Neely & Weller, 2011).
How do trends connect to risk management?
Trend-following tools give false signals when no strong trend exists: ChartSchool’s moving-average lesson shows an example with three whipsaws before one profitable move (StockCharts). Several losses in a row — and the drawdown they cause — can therefore be part of the method rather than a sign it has broken. That is exactly why risk per trade has to be small and fixed before any trend line is drawn.
The trend line can help in one practical way: it marks where your reading is wrong. If an idea depends on the uptrend continuing, a decisive close below the line — or below the last higher low — is the point to have defined in advance. The distance to that point sets the size. With a $5,000 account risking 1% ($50) and an exit point 25 pips away on EUR/USD at $10 per pip per standard lot, the size is 0.20 lot — worked arithmetic, not a recommendation. The position size calculator runs the same sum for any pair.
Previous lesson: support and resistance. Next: moving averages, a way of describing trend with a calculation instead of a hand-drawn line. Course overview: technical analysis hub.
Frequently asked questions
How do you identify a trend in forex?
Mark the swing highs and lows on your chosen timeframe. If both are rising — higher highs and higher lows — the trend on that chart is up; if both are falling it is down; if price keeps returning to similar highs and lows it is a range. The answer can differ between timeframes.
How many points do you need to draw a trend line?
Two points are enough to draw a trend line; under ChartSchool’s general rule, a third touch confirms it. More touches add weight, but evenly spaced touches matter more than squeezing in extra ones. If a line has to be forced to fit, it is better not drawn.
Do you draw trend lines on wicks or bodies?
ChartSchool’s trend-line guide speaks only of connecting low points or high points and does not address wicks versus bodies, so it is your choice — one reason trend lines are subjective. Whatever you choose, apply it consistently, and expect wicks to poke through lines without that meaning the trend has ended.
What happens when a trend line breaks?
A break is a warning that the trend may be changing, not proof. Educational references recommend checking other evidence, such as horizontal support and resistance or the sequence of highs and lows, and warn that false breaks happen.
Is trend trading good for beginners?
Trend-following tools can give several false signals in a row when the market is not trending, so losing streaks are a normal part of using them. Without small, fixed risk per trade, those streaks can cause deep drawdowns. Learn risk per trade and position sizing before trading any trend method, and practise on a demo account first.
Keep going
Sources
- StockCharts ChartSchool — Trend Lines (two points draw a line, a third confirms; steep lines less reliable; a break is a warning, not a confirmation)
- CME Group Education — Trend and Continuation Patterns (patterns do not always signal continuation)
- CME Group Education — Support and Resistance (levels as zones, one input alongside other analysis)
- StockCharts ChartSchool — Technical Analysis (overview: likelihoods not certainties; weaknesses incl. analyst bias, subjectivity, lateness, unreliable signals)
- StockCharts ChartSchool — Moving Averages: Simple and Exponential (SMA/EMA formulas, multiplier 2 ÷ (periods + 1), lag, whipsaws)
- Neely, C. J. & Weller, P. A. — Technical Analysis in the Foreign Exchange Market, Federal Reserve Bank of St. Louis Working Paper 2011-001 (revised July 2011)
- John J. Murphy — Technical Analysis of the Financial Markets (Prentice Hall Press, 1999) — publisher page