
COURSE 3 · READING CHARTS · LESSON 1
How to Read Candlestick Charts (and What They Can't Tell You)
Every forex platform opens on a candlestick chart. Here is how to read one candle, then a row of them — and the one thing no candle can show you.
By FirstPip editorial team · Updated 2026-10-13 · Educational content · No broker owns this site
Quick answer. A candlestick shows four prices for one period: open, high, low and close. The thick body spans open to close; thin wicks reach the high and low. A hollow or green body closed higher than it opened, a filled or red one lower. Candles describe the past; they don't predict.
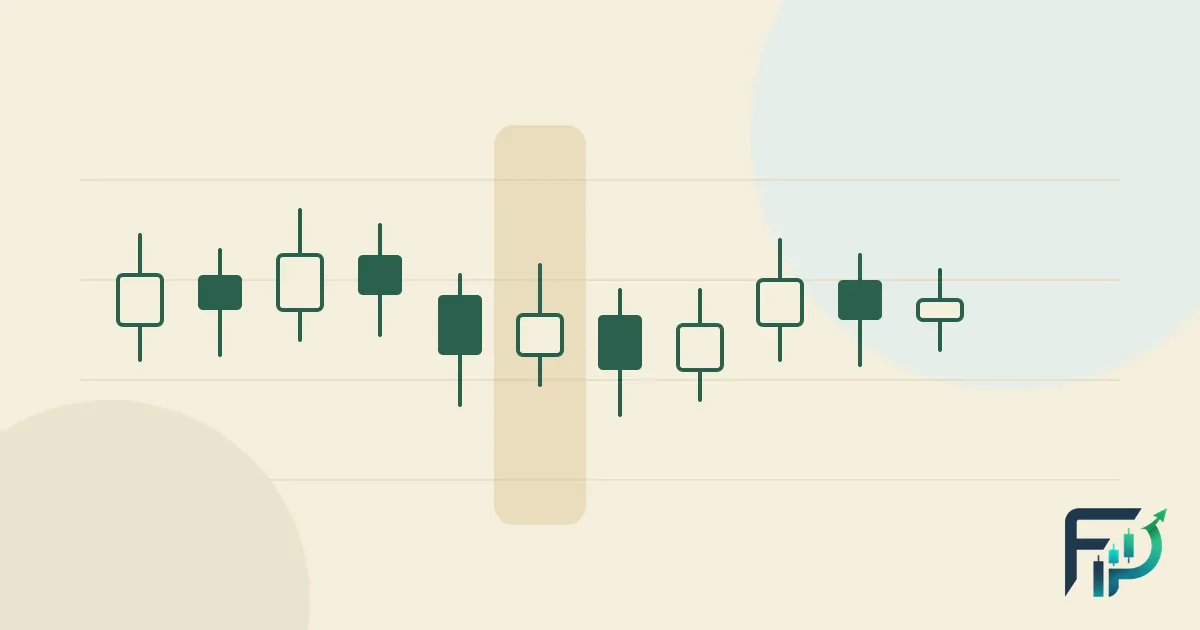
What is a candlestick chart?
A candlestick chart draws each period of trading — one minute, one hour, one day — as a single shape called a candle. Each candle packs four prices into one picture: where price opened, the highest it reached, the lowest it fell to, and where it closed. Line up a few dozen candles and you can see at a glance how a currency pair has moved, how volatile it has been, and where buyers or sellers seemed to take control.
CME Group’s education course names candlestick, bar and line charts as the most common chart types. It describes the three — candlestick, line and bar — and notes that a line chart plots only closing prices, while candlestick and bar charts both show open, high, low and close (CME Group). Candlesticks make the relationship between those four prices easy to see at a glance.
How do you read a single candle?
Read a candle in two parts: the thick real body and the thin shadows (also called wicks or tails). The body spans the opening price and the closing price. The shadows stretch from the body to the highest and lowest prices traded in the period (StockCharts ChartSchool).
| Part of the candle | What it shows | Rising candle in Figure 1 |
|---|---|---|
| Open | First traded price of the period | 1.0815 (bottom of the body) |
| Close | Last traded price of the period | 1.0850 (top of the body) |
| High | Highest price reached | 1.0860 (tip of the upper shadow) |
| Low | Lowest price reached | 1.0800 (tip of the lower shadow) |
The arithmetic is simple. The body of that rising candle is 1.0850 − 1.0815 = 0.0035, or 35 pips on EUR/USD. The full range from high to low is 60 pips. So the period spanned a 60-pip range but ended only 35 pips above where it began — the shadows tell you price went further both ways than the final result suggests. If counting pips is new to you, the lesson what is a pip walks through it.
What do the colours of a candle mean?
Colour tells you direction, nothing more. A candle that closed above its open is drawn hollow, white or green; one that closed below its open is drawn filled, black or red. CME notes the colours depend on your software settings (CME Group), so always check your platform’s legend before assuming. A green candle is not “good” and a red one is not “bad”: they only record whether the close was above or below the open for that one period.
One more detail matters in forex. A buy order fills at the ask and a sell at the bid price; the gap between them is the spread. Check which price your platform draws the chart from: if it is the bid, a price you see touched on the chart is not always a price you could have bought at — something to remember when a level appears to be hit “to the pip”.
What do long and short bodies and shadows suggest?
Traders read the proportions of a candle as a rough record of who had the upper hand during the period. ChartSchool describes long bodies as intense buying or selling pressure, short bodies as little price movement, and long shadows as prices that extended well past the open and close (StockCharts). The table puts those readings next to their limits.
| Shape | What traders read into it | Why that reading can mislead |
|---|---|---|
| Long body, small shadows | One side was in control most of the period | Its meaning depends on where it appears — after a long fall, a long red candle can mark exhaustion rather than strength |
| Small body, long shadows both sides (spinning top) | Indecision: both sides pushed, neither won | On its own the shape does not tell you what the next period will do |
| Long lower shadow | Sellers pushed price down, buyers pushed it back | A single news spike can draw the same shape |
| Long upper shadow | Buyers pushed price up, sellers pushed it back | Same caution: one candle is one period, not a trend |
| No shadows (marubozu) | One side controlled trading from open to close | On a short timeframe this can happen in a quiet minute |
What is a doji candle?
A doji is a candle whose open and close are almost the same, so the body is a thin line. ChartSchool describes it as a tug-of-war between buyers and sellers that ended level, and stresses that a doji is neutral on its own: any bias comes from the price action before it and the confirmation after it (StockCharts). Variants with a long lower shadow (“dragonfly”) or a long upper shadow (“gravestone”) are named in the literature, but the same caution applies — without what comes next, a doji only says the period closed where it opened.
Why does the timeframe change what a candle shows?
Every candle summarises a chosen slice of time, so the same market looks different at different settings. One daily candle on EUR/USD contains the same trading as 24 hourly candles or 1,440 one-minute candles. A day that looks like a calm doji on the daily chart may hide a sharp spike and recovery on the hourly chart.
If two platforms start their daily candle at different times, the same pair will show slightly different daily candles on each. It is also tempting to jump between timeframes until one “agrees” with the trade you already wanted — the kind of personal bias ChartSchool warns can be reflected in the analysis (StockCharts). Pick one main timeframe for study and stick with it.
What can a candlestick not tell you?
A candle records four prices but not the path between them. ChartSchool points out that candlesticks show the relationship between open, high, low and close, but not the order in which the high and low occurred — different intraday sequences can produce the same candle (StockCharts). Figure 2 shows why that matters for risk.
A candle also cannot tell you why price moved, whether the move will continue, or how far it will go next. It describes; it does not forecast. When you look back at a chart and a pattern seems to have “called” a turn, remember all the identical patterns that were followed by nothing — they are on the same chart, but your eye skips them.
Do candlestick patterns actually work?
There is no reliable evidence that a candle pattern on its own gives you an edge after costs. Candlestick charting has a long history — ChartSchool traces it to Japanese rice traders and credits Steve Nison’s research for dating the charts to sometime after 1850 (StockCharts); Nison’s book Japanese Candlestick Charting Techniques is the standard reference (publisher page). But a long history is not proof of profitability.
Even ChartSchool, which teaches the patterns, says reversal patterns such as hammers and shooting stars need follow-through and a prior trend before they mean anything. And research on currency markets found that simple technical trading rules on dollar exchange rates stopped earning excess returns after the 1970s and 1980s (Neely & Weller, 2011). Treat named patterns as vocabulary for describing price, not as instructions.
How can you practise reading candles without risking money?
Use real charts and no real money. A simple routine for a week:
- Open a daily EUR/USD chart. For the last 20 candles, say out loud: direction (colour), body size in pips, and which shadow is longer.
- Switch to the hourly chart for one of those days and see how many different paths could have built that daily candle.
- Note in a trading journal what you would have expected after three dojis or three long candles — then check honestly how often you were right.
- Before any practice trade on a demo account, decide where you would be wrong and size the trade first, using position sizing and the position size calculator.
Next in the course: support and resistance, which uses the highs and lows of candles to mark zones where price has reacted before. The overview of the whole course is on the technical analysis hub.
Frequently asked questions
How do you read a candlestick chart for beginners?
Look at each candle in two parts. The thick body runs from the open to the close; a hollow or green body closed higher than it opened, a filled or red one lower. The thin shadows reach the highest and lowest prices of the period. Then read candles in sequence to see direction and volatility, remembering that each candle summarises one period only.
What does a green candle mean in forex?
Generally a green candle means the close was higher than the open for that period. Colours are a software setting, so check your platform. A green candle says nothing about what happens next; it only records the direction of one period.
What is the wick on a candlestick?
The wick, or shadow, is the thin line above or below the body. It shows the highest and lowest prices traded during the period. A long wick means price travelled far in that direction but did not stay there by the close.
What does a doji mean?
A doji is a candle whose open and close are nearly equal, so it has a very small body. It shows a period that ended roughly where it began — indecision. On its own it is neutral; any meaning depends on the trend before it and what the next candles do.
Are candlestick patterns reliable?
Not on their own. Educational references say reversal patterns need a prior trend and confirmation, and research on currency markets found well-known technical rules lost their edge over time. Use patterns as a way to describe price, and size every trade so a wrong reading costs little.
Keep going
Sources
- StockCharts ChartSchool — Introduction to Candlesticks (body and shadows, doji, need for confirmation, candles do not show the order of high and low)
- CME Group Education — Chart Types: candlestick, line, bar
- Steve Nison — Japanese Candlestick Charting Techniques, 2nd edition (Prentice Hall Press, 2001) — publisher page
- Neely, C. J. & Weller, P. A. — Technical Analysis in the Foreign Exchange Market, Federal Reserve Bank of St. Louis Working Paper 2011-001 (revised July 2011)
- StockCharts ChartSchool — Technical Analysis (overview: likelihoods not certainties; weaknesses incl. analyst bias, subjectivity, lateness, unreliable signals)
- CFTC — Customer Advisory: Eight Things You Should Know Before Trading Forex (about two in three customers lost money, Q2 2021–Q1 2022)
- ESMA — “ESMA agrees to prohibit binary options and restrict CFDs to protect retail investors”, 27 March 2018 (national regulators’ analyses: 74–89% of retail CFD accounts typically lose money)