
COURSE 3 · READING CHARTS · LESSON 2
Support and Resistance: Zones Where Price Has Reacted Before
Support and resistance are some of the simplest lines to draw on a chart. Drawn honestly, they are zones that describe the past and mark where an idea is wrong — not walls that price must respect.
By FirstPip editorial team · Updated 2026-10-13 · Educational content · No broker owns this site
Quick answer. Support is a price zone where falling prices have paused or turned up; resistance is a zone where rising prices have paused or turned down. They are drawn from past highs and lows, work best as zones rather than exact lines, and can break, so they are never guarantees.
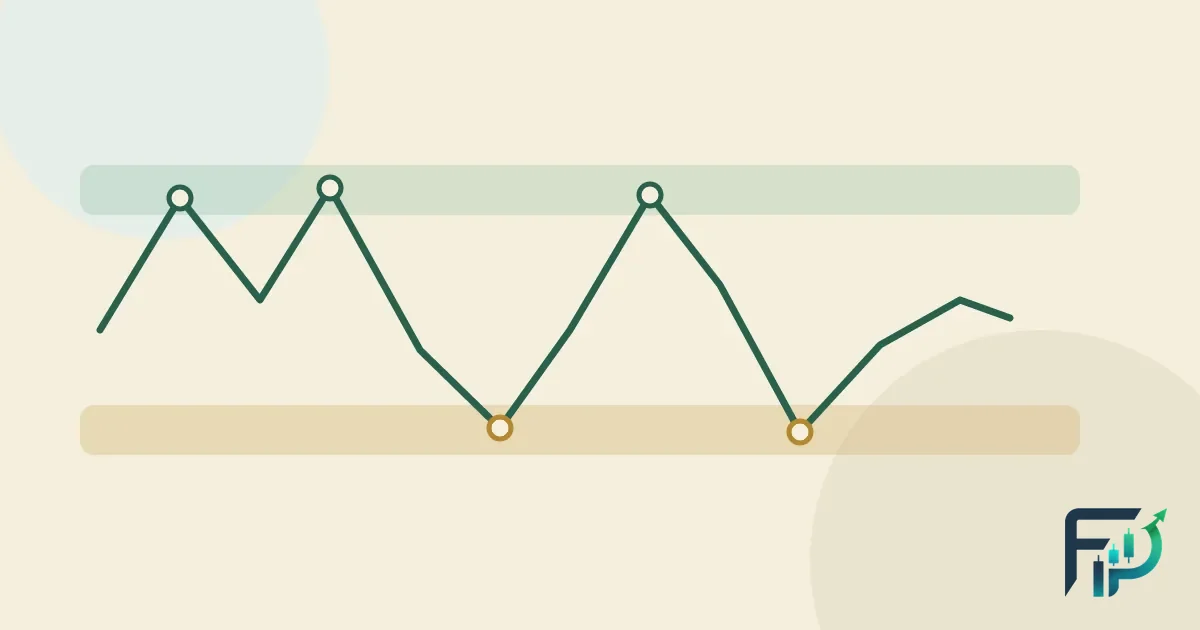
What is support and resistance?
Support is a price area below the current price where a falling market has paused or turned up before. Resistance is a price area above the current price where a rising market has paused or turned down before. Both are drawn from the past: you find them by looking back at where price reacted, then watching what happens when it returns.
ChartSchool frames the idea in terms of supply and demand: support is where demand has been strong enough to stop a decline, resistance is where selling has been strong enough to stop an advance (StockCharts ChartSchool). CME Group’s course uses the same plain definitions — a level below price where a falling market may stall or reverse, and a level above where a rising market may stall or reverse (CME Group). Note the word may in both. Support and resistance describe places worth watching, not places where price must turn.
Why might price react at the same level again?
Because market participants can watch the same obvious prices. If EUR/USD fell to roughly 1.0810 three times and bounced each time, traders who noticed will be watching 1.0810 the fourth time too — some planning to buy there, some with protective stops just below it, some waiting to see if it breaks. Their combined orders can make the area react again, which reinforces the idea. Or the balance of supply and demand may have shifted since, and the level gives way.
That is the whole mechanism, and it is why support and resistance can never be certain. A level is a memory of past behaviour, not a law. ChartSchool describes a level as an alert to watch closely for signs of buying or selling pressure, and states plainly that support does not always hold (StockCharts).
How do you find support and resistance on a forex chart?
CME lists where traders look: previous highs and lows, specific price levels, moving averages and trend lines (CME Group). For a beginner, previous highs and lows are the clearest starting point. A simple routine:
- Zoom out first. Open a daily chart covering several months so you see the major turning points, not the noise of the last hour.
- Mark the obvious swing lows and highs. Look for places where price turned more than once. One touch is an observation; two or three in the same area is a candidate level.
- Draw a zone, not a line. Shade the area that covers the candle bodies and most of the wicks at those turns.
- Note specific price levels nearby. CME points out that particular prices can themselves act as support or resistance.
- Write down what would make the zone wrong. For example: two daily closes clearly beyond it.
Later lessons add two more sources of levels: trend lines slope with the market, and moving averages move with it, so both act as “dynamic” support or resistance rather than fixed prices.
Why are support and resistance zones, not exact lines?
Because markets overshoot. Both of the education sources above recommend treating levels as zones: ChartSchool says exact levels are hard to set and suggests zones for wider, longer trading ranges, which also allow for brief moves beyond a level that do not amount to a real break (StockCharts); CME says the levels won’t always hold precisely (CME Group).
Forex adds two reasons of its own. If your chart is drawn from the bid price, the price you can buy at sits above it by the spread, so a level “touched” on the chart may never have been tradeable for you. And wicks can poke through a line without the level having broken. Drawing the zone wide enough to cover the wicks at past turns — the zones in Figure 1 are 15 pips deep — is an honest way to admit that uncertainty.
What is role reversal in support and resistance?
Role reversal is the tendency for a broken level to change jobs: broken support can become resistance, and broken resistance can become support. ChartSchool explains the logic — buyers who bought at a support that later failed may sell when price returns there to get out with little or no loss, adding supply at the old support (StockCharts). CME describes the same flip (CME Group).
In Figure 1, after the path climbs clearly above the 1.0900–1.0915 resistance zone, it later dips back to 1.0912 — inside the old zone — before moving higher. The question mark in the label is deliberate. You only know the old resistance “acted as support” after price has moved away from it. At the moment it was being tested, the same picture was equally consistent with a failed breakout.
What is a false break?
A false break, or false breakout, is a move beyond a level that quickly reverses back inside it. ChartSchool shows an example of a brief move above resistance that was erased within days (StockCharts). In Figure 1 the path pokes to 1.0921, six pips above the resistance zone’s upper edge at 1.0915, then falls straight back.
False breaks are why some traders wait for a close beyond a zone rather than reacting to the first touch — and why even that is no protection. A daily close beyond a zone can also reverse the next day. There is no rule that separates real breaks from false ones in advance; there is only a decision about how much you are willing to lose if this one is false.
What can support and resistance not tell you?
Support and resistance cannot tell you whether a level will hold, how far price will go if it breaks, or when the test will happen. Specifically:
- No probability. A level that held three times has no measured chance of holding a fourth. Each touch can also be the one that breaks it.
- Hindsight. Levels look clean on old charts because you can see which ones mattered. In real time you are looking at dozens of candidate levels.
- Subjectivity. Two people mark different zones on the same chart, and both can justify their choice.
- News. A rate decision can move price straight through a zone, and a stop-loss order may then be filled at a worse price than the one you set.
- Fading edges. Research on currency markets found that simple technical trading rules on dollar exchange rates stopped earning excess returns after the 1970s and 1980s (Neely & Weller, 2011). Support and resistance is standard textbook material, taught in the free references cited on this page.
How do support and resistance connect to risk management?
Their most defensible use is not finding entries but deciding where an idea is wrong. If your reading of the chart depends on a support zone holding, then price closing well below that zone means your reading was wrong — that is a logical place for a stop, a little beyond the zone rather than on the line, where wicks and the spread would trip it. The lesson how to set a stop loss covers this in detail.
The distance to that point, in pips, then sets the size of any trade — not the other way round. With a $5,000 account and a 1% risk limit, you can lose $50. If the stop sits 25 pips away and a standard lot of EUR/USD moves $10 per pip, the size is $50 ÷ (25 × $10) = 0.20 lot. A wider zone means a wider stop and a smaller position for the same risk. This is arithmetic for understanding, not a trade suggestion; try your own numbers in the position size calculator.
What mistakes do beginners make with support and resistance?
- Drawing too many levels. If every price is near a level, no level means anything. Keep the two or three clearest zones.
- Treating a line as a wall. Expecting price to turn at an exact price leads to stops placed exactly where wicks reach.
- Ignoring the timeframe. A level on a 5-minute chart reflects far less trading history than one visible on a daily chart.
- Moving the stop when the level breaks. If the zone that defined your idea has failed, the idea has failed; widening the stop just enlarges the loss. See risk-reward ratio for why that arithmetic matters.
- Forgetting the odds. Regulators report that most retail accounts lose money — about two in three at US forex dealers over Q2 2021 to Q1 2022 (CFTC), and 74–89% of retail CFD accounts in ESMA’s March 2018 figures (ESMA). Nothing in those figures suggests that knowing where support is protects you.
Previous lesson: how to read candlestick charts. Next: trends and trend lines. The full course outline is on the technical analysis hub.
Frequently asked questions
What is support and resistance in simple words?
Support is a price area where a falling market has stopped or bounced before; resistance is an area where a rising market has stopped or turned down before. Traders watch these areas because price has reacted there in the past, but there is no guarantee it will react again.
How do you draw support and resistance for beginners?
Zoom out to a daily chart, find places where price turned more than once, and shade a zone around those turns instead of drawing a single line. Note specific price levels nearby. Keep only the two or three clearest zones, and note what would prove each one wrong.
Why does support become resistance?
When support breaks, traders who bought there are now holding a loss. When price comes back up to that level, some sell to get out with little or no loss, adding supply. That can make the old support act as resistance — though it does not always happen.
How reliable is support and resistance in forex?
There is no reliable success rate. Levels can break, false breaks happen, and two analysts can draw different zones on the same chart. Treat a level as a place to watch and to define where an idea is wrong, and keep the risk on any trade small.
Where should a stop-loss go relative to support?
If a trade idea depends on a support zone holding, the logical stop sits a little beyond the zone, not exactly on the line, so normal wicks and the spread do not trigger it. The distance to that stop then decides the position size. This describes the logic, not a recommendation to trade.
Keep going
Sources
- StockCharts ChartSchool — Support & Resistance (zones vs exact levels, role reversal, false breakouts)
- CME Group Education — Support and Resistance (levels as zones, one input alongside other analysis)
- Neely, C. J. & Weller, P. A. — Technical Analysis in the Foreign Exchange Market, Federal Reserve Bank of St. Louis Working Paper 2011-001 (revised July 2011)
- StockCharts ChartSchool — Technical Analysis (overview: likelihoods not certainties; weaknesses incl. analyst bias, subjectivity, lateness, unreliable signals)
- CFTC — Customer Advisory: Eight Things You Should Know Before Trading Forex (about two in three customers lost money, Q2 2021–Q1 2022)
- ESMA — “ESMA agrees to prohibit binary options and restrict CFDs to protect retail investors”, 27 March 2018 (national regulators’ analyses: 74–89% of retail CFD accounts typically lose money)
- John J. Murphy — Technical Analysis of the Financial Markets (Prentice Hall Press, 1999) — publisher page