
COURSE 3 · READING CHARTS · LESSON 4
Moving Averages Explained: SMA, EMA and the Lag You Can't Remove
Moving averages turn a noisy chart into a smooth line. The price of that smoothness is lag — and no setting removes it. Here is the arithmetic, worked through on ten closes.
By FirstPip editorial team · Updated 2026-10-13 · Educational content · No broker owns this site
Quick answer. A moving average is the average closing price over a set number of periods, recalculated each period. A simple moving average (SMA) weights every close equally; an exponential moving average (EMA) weights recent closes more. Both are built from past prices, so they always lag and cannot forecast.
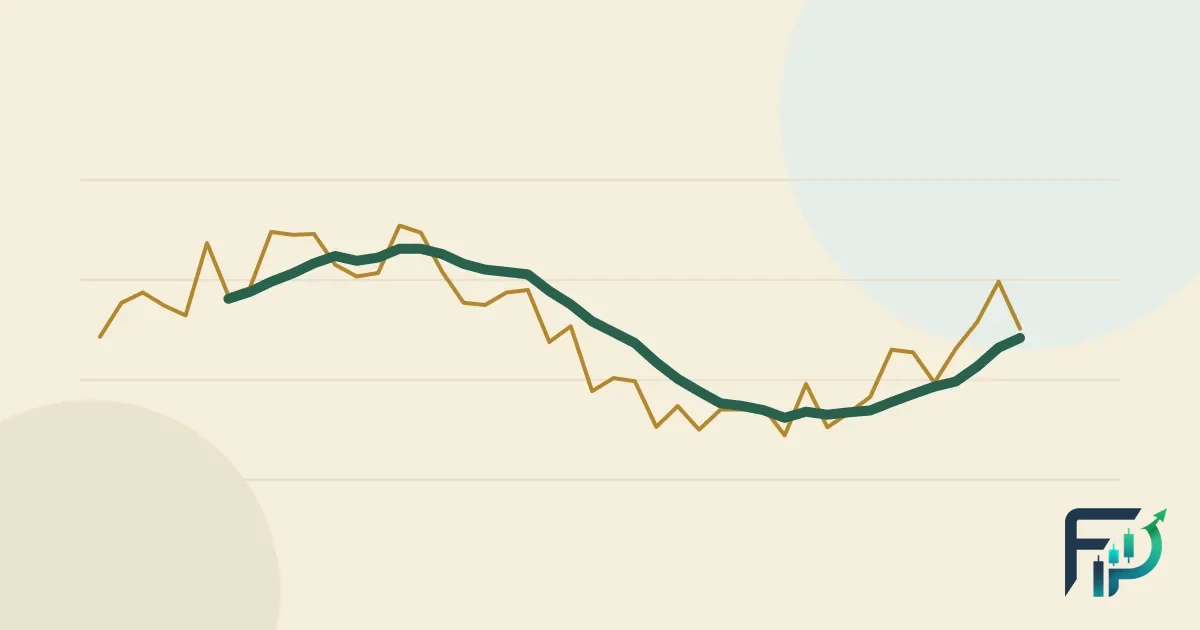
What is a moving average?
A moving average is the average of a market’s closing prices over a fixed number of recent periods, recalculated every time a new period closes. A 20-day moving average, for example, is the average of the last 20 daily closes; tomorrow the oldest close drops off and the newest one is added, so the average “moves” along the chart as a smooth line.
Its job is to filter out some of the period-to-period noise so the underlying direction is easier to see. CME Group’s course defines it the same way — the average price over a set period, such as the last 14 closes (CME Group). CME describes it as often one of the first indicators traders add to their charts, and it is also the clearest illustration of a limit every indicator shares: it is built entirely from past prices.
How do you calculate a simple moving average?
Add the last n closing prices and divide by n. Every close in the window carries equal weight (StockCharts ChartSchool). Using ten illustrative EUR/USD closes (made-up numbers for the example), the first 5-period simple moving average (SMA) appears on day 5:
SMA(5) on day 5 = (1.0800 + 1.0815 + 1.0830 + 1.0822 + 1.0840) ÷ 5 = 5.4107 ÷ 5 = 1.08214
On day 6 the window slides: the day-1 close of 1.0800 drops out and the day-6 close of 1.0845 comes in, giving 1.08304. There is no SMA for days 1–4 because there are not yet five closes to average — a small reminder that every moving average needs history before it exists.
How is an exponential moving average calculated?
An exponential moving average (EMA) gives more weight to recent closes, so it reacts faster. ChartSchool sets out the standard method in three steps (StockCharts):
- Start (“seed”) the EMA with the first simple moving average — here 1.08214 on day 5.
- Work out the multiplier: 2 ÷ (periods + 1). For 5 periods that is 2 ÷ 6 = 0.3333, or about 33%. For a 10-period EMA it would be 2 ÷ 11, about 18%.
- Each new period: EMA = (close − previous EMA) × multiplier + previous EMA.
EMA(5) on day 6 = (1.0845 − 1.08214) × 0.3333 + 1.08214 = 1.08293
Because each value is built on the previous one, an EMA technically carries a trace of every price since it started. ChartSchool notes its accuracy improves with more history behind it (StockCharts) — another reason two platforms can show slightly different EMA values for the same pair.
| Day | Close (illustrative) | SMA(5) | EMA(5) |
|---|---|---|---|
| Day 1 | 1.0800 | — | — |
| Day 2 | 1.0815 | — | — |
| Day 3 | 1.0830 | — | — |
| Day 4 | 1.0822 | — | — |
| Day 5 | 1.0840 | 1.08214 | 1.08214 |
| Day 6 | 1.0845 | 1.08304 | 1.08293 |
| Day 7 | 1.0838 | 1.08350 | 1.08322 |
| Day 8 | 1.0850 | 1.08390 | 1.08381 |
| Day 9 | 1.0880 | 1.08506 | 1.08521 |
| Day 10 | 1.0910 | 1.08646 | 1.08714 |
What is the difference between an SMA and an EMA?
| Simple moving average (SMA) | Exponential moving average (EMA) | |
|---|---|---|
| Weighting | Every close in the window counts equally | Recent closes count more |
| Reaction to new prices | Slower | Faster |
| Lag | More | Less — but never zero |
| Turns | Later; a true average of the whole window | Earlier — ChartSchool: EMAs turn before SMAs |
| On day 10 in the example | 1.08646 (45.4 pips below the close) | 1.08714 (38.6 pips below the close) |
Neither is better in general. Reacting sooner means reacting to moves that may not last; reacting later means giving up more of the move before the average turns. That trade-off can be chosen, not removed.
What is moving-average lag, and why can’t you remove it?
Lag is the delay between a change in price and the moving average reflecting it. It exists because the average is made of past closes: by definition it cannot respond to a price that has not happened. ChartSchool states it directly — moving averages are trend-following, always lag, and won’t catch tops or bottoms; longer averages lag more (StockCharts).
In the example, prices rise overall and both averages trail underneath. By day 10 the EMA trails by less because it weights the latest closes more, but it still trails. When the rise stops, both lines will keep pointing up for a while — the averages are still digesting closes from days ago. Any “signal” built on them inherits that delay.
What do traders read from a moving average?
Moving averages are mainly used to describe trend, in four common ways. Each is a description, not an instruction:
- Slope. A rising average describes an uptrend over its period; a falling one, a downtrend; a flat one, a range.
- Price above or below. Price above the average is read as strength over that period, below as weakness.
- Dynamic support or resistance. In trends, price sometimes pauses near a widely watched average. CME notes that a longer average such as the 100-period is considered to provide stronger support than a short one (CME Group), and ChartSchool advises treating them as zones because markets overshoot (StockCharts). The lesson on support and resistance explains why zones beat lines.
- Crossovers. A shorter average crossing above a longer one is read as bullish, crossing below as bearish. The bullish version is known as a “golden cross” and the bearish one a “death cross” (StockCharts); CME’s example is a 50-period EMA crossing above a 200-period EMA (CME Group).
Why do moving averages give false signals?
Because a trend-following tool has nothing useful to follow when there is no strong trend. ChartSchool describes crossovers producing late signals and many whipsaws when no strong trend exists, with an example showing three whipsaws before one profitable move (StockCharts). In a sideways market, price crosses back and forth over the average and each cross looks like a fresh signal.
The filters suggested in the literature — waiting for a cross to hold for a few periods (a time filter), or requiring the averages to separate by a set amount (a price filter) — reduce whipsaws by adding more delay. They change which mistakes you make; they do not remove mistakes.
Which moving-average period should a beginner use?
There is no correct period, and anyone who claims one has found it should be treated with caution. ChartSchool says the right type and length depend on the trader’s time horizon and objectives (StockCharts). ChartSchool’s own examples are a 20-day average for short-term trends and a 200-day average for long-term ones; CME’s examples use 50- and 200-period EMAs (CME Group).
For learning, pick one short and one long average, keep them fixed, and watch how they behave across trends and ranges on a demo chart. Changing the period every time a signal fails is the moving-average version of drawing the trend line wherever the chart agrees with you.
What can moving averages not tell you?
- The next price. An average is a summary of the past; Figure 1 ends on day 10, and nothing in it says what day 11 does.
- Tops and bottoms. By construction, the turn shows up in the average after it has happened in price.
- Whether a cross is real. A crossover that “worked” on an old chart is judged with hindsight: you already know the outcome.
- Whether the rule still pays. Research on currency markets found simple technical trading rules on dollar exchange rates earned excess returns in the 1970s and 1980s before those returns were extinguished (Neely & Weller, 2011). The simple rules they describe are moving-average and filter rules.
How do moving averages connect to risk management?
Use them to frame the trend and to decide where an idea is wrong — never to decide how much to risk. If your reading depends on price staying above a long average, a decisive close below it marks the point to have planned for. The distance to that point sets the trade size: with a $5,000 account risking 1% ($50) and an exit 25 pips away on EUR/USD at $10 per pip per standard lot, the size is 0.20 lot. That is worked arithmetic, not a recommendation; the position size calculator does it for any pair, and the pip calculator shows what each pip is worth.
Because whipsaws produce losing streaks, keep risk per trade small enough that ten losses in a row would be survivable, and check what that streak does to your account in the drawdown lesson. Regulators report that most retail forex and CFD accounts lose money — about two in three at US forex dealers over Q2 2021 to Q1 2022 (CFTC) and 74–89% in ESMA’s March 2018 figures (ESMA). Nothing in those figures suggests an indicator setting changes the odds.
Previous lesson: trends and trend lines. This completes Course 3; the technical analysis hub has the full outline, and Learn lists every course.
Frequently asked questions
What is a moving average in forex?
A moving average is the average closing price of a currency pair over a set number of recent periods, recalculated each period so it moves along the chart as a smooth line. It helps describe the direction of the trend, but because it is built from past prices it always lags.
What is the difference between SMA and EMA?
A simple moving average weights every close in its window equally. An exponential moving average gives more weight to recent closes, using a multiplier of 2 divided by the number of periods plus 1. The EMA reacts faster and lags less; the SMA is a true average of the whole window. Both lag, and both can whipsaw when there is no strong trend.
Which moving average is best for beginners?
There is no best setting. Educational sources say the right type and length depend on your time horizon. For learning, choose one short and one long average, keep them fixed, and observe how they behave in trends and in ranges on a demo chart before relying on them for anything.
What is a golden cross?
A golden cross is when a shorter moving average crosses above a longer one — for example a 50-period average crossing above a 200-period average. It is read as a bullish description of trend. Like all crossovers it arrives late and can be followed by a reversal, so it is not a reliable buy signal on its own.
Why do moving average crossovers fail?
Moving averages follow trends, and markets do not always trend. In a range, price and the averages cross back and forth, and each cross looks like a new signal. Filters that wait for confirmation reduce these whipsaws only by adding more delay.
Keep going
Sources
- StockCharts ChartSchool — Moving Averages: Simple and Exponential (SMA/EMA formulas, multiplier 2 ÷ (periods + 1), lag, whipsaws)
- CME Group Education — Understanding Moving Averages (SMA vs EMA, crossovers)
- CME Group Education — Support and Resistance (levels as zones, one input alongside other analysis)
- Neely, C. J. & Weller, P. A. — Technical Analysis in the Foreign Exchange Market, Federal Reserve Bank of St. Louis Working Paper 2011-001 (revised July 2011)
- CFTC — Customer Advisory: Eight Things You Should Know Before Trading Forex (about two in three customers lost money, Q2 2021–Q1 2022)
- ESMA — “ESMA agrees to prohibit binary options and restrict CFDs to protect retail investors”, 27 March 2018 (national regulators’ analyses: 74–89% of retail CFD accounts typically lose money)
- StockCharts ChartSchool — Technical Analysis (overview: likelihoods not certainties; weaknesses incl. analyst bias, subjectivity, lateness, unreliable signals)